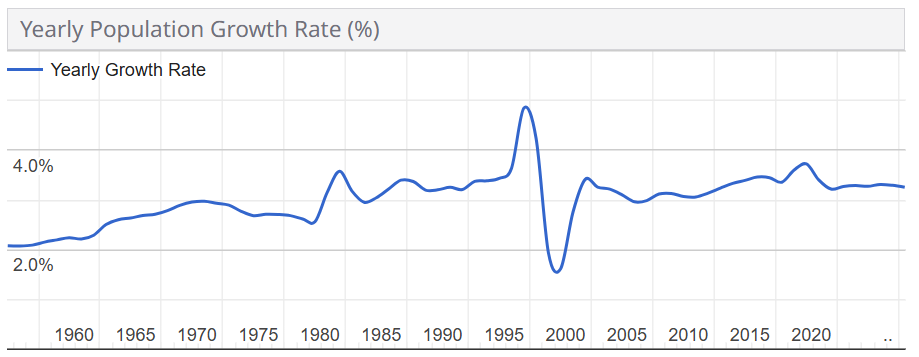
World Population Data Matters!!!
The availability of global statistics has exploded. Governments, international organizations, and research institutions now collect and publish vast amounts of data on everything from population growth to economic development. This wealth of information has opened up new opportunities for analysis and understanding, allowing us to make more informed decisions about everything from public policy to business strategy.
Population data can be used for a vairety of reasons AND for a variety of people. Travelers will want to know the area, migrants want to know where to live, and economists want to be able to predict trends. An older population could indicate more strain on social security and a lower birthrate.
| Country | Growth Rate (%) |
|---|---|
| Russia | -0.57 |
| Japan | -0.52 |
| China | -0.23 |


Analysis
Russia, Japan, and China have negative growth rates, indicating a declining population. This can lead to challenges relating to an aging population, such as labor shortages and increased healthcare costs.
More specifically, Japan has increasingly higher costs of living and a low birth rate, leading to a shrinking workforce since people are increasingly less in a position where they can comfortably support a child. Russia faces similar issues, compounded by emigration (in part due to the impact of ongoing war) and health crises. China's declining population can be attributed to the years spent under the one-child policy.
| Country | Growth Rate (%) |
|---|---|
| DR Congo | 3.25 |
| Ethiopia | 2.58 |

Analysis
DR Congo and Ethiopia have the highest annual population growth rates among the top 15 countries. Rapid population growth can strain resources, though there are advantages to a higher working population.
This can be attributed to high fertility rates. For example, DR Congo has a fertility rate of 5.9, meaning that, on average, women in DR Congo have about 6 children. Ethiopia also has a high fertility rate of 3.81. Both countries also have relatively low median ages (15.8 for DR Congo and 19.1 for Ethiopia), indicating a young population with many individuals entering their childbearing years. It's also worth noting that, despite having the highest growth, they are not the highest population. This is usually because high fertility rates is often associated with high mortality rates as well.
Highest GDPs
As of 2023, the United States holds the position of the world's largest economy with a GDP of $27.72 trillion, followed by China at $17.79 trillion and Germany at $4.53 trillion. Notably, India is experiencing rapid economic growth with an 8.15% increase in GDP, highlighting its emerging market status.
| Rank | Country | Nominal GDP (USD) |
|---|---|---|
| 1 | United States | $27,720,700,000,000 |
| 2 | China | $17,794,800,000,000 |
| 5 | India | $3,567,550,000,000 |
GDP Compared to Population
High population numbers don't seem to correlate with GDP per capita at all when looking at the top ten countries. For example, China and India both have populations over 1.4 billion, but while China is 2nd in GDP, India is only 5th with a GDP per capita of just $2,481 compared to China's of $12,509.
This is interesting, because GDP per capita should go down with a higher population. the equation to calculate per capita is GDP/population, meaning a higher population lowers the number.
Meanwhile, countries like Germany at 84 million GDP, the United Kingdom at 69 million GDP, and Canada at 39 million GDP still rank in the top ten despite lower populations. They also all have dramatically larger GDP per capita amounts than India.
| # | Country | GDP (nominal, 2023) | Population 2023 | GDP per capita |
|---|---|---|---|---|
| 2 | China | $17,794,800,000,000 | 1,422,584,933 | $12,509 |
| 5 | India | $3,567,550,000,000 | 1,438,069,596 | $2,481 |
| # | Country | GDP (nominal, 2023) | Population 2023 | GDP per capita |
|---|---|---|---|---|
| 3 | Germany | $4,525,700,000,000 | 84,548,231 | $53,528 |
| 6 | United Kingdom | $3,380,850,000,000 | 68,682,962 | $49,224 |
| 10 | Canada | $2,142,470,000,000 | 39,299,105 | $54,517 |