
World Population by Country (2025)
Exploring global population distribution and trends
Exploring global population distribution and trends
This is a table of the top fifteen most populous countries in the world as of 2025. In this website, you will find an analysis of some of the data presented, especially as it pertains to how the population would be affecting various countries and why the trends are the way they are.
| # |
Country (or dependency) |
Population 2025 |
Yearly Change |
Net Change |
Density (P/Km²) |
Land Area (Km²) |
Migrants (net) |
Fert. Rate |
Median Age |
Urban Pop % |
World Share |
|---|---|---|---|---|---|---|---|---|---|---|---|
| 1 | India | 1,463,865,525 | 0.89% | 12,929,734 | 492 | 2,973,190 | −495,753 | 1.94 | 28.8 | 37.1% | 17.78% |
| 2 | China | 1,416,096,094 | −0.23% | −3,225,184 | 151 | 9,388,211 | −268,126 | 1.02 | 40.1 | 67.5% | 17.20% |
| 3 | United States | 347,275,807 | 0.54% | 1,849,236 | 38 | 9,147,420 | 1,230,663 | 1.62 | 38.5 | 82.8% | 4.22% |
| 4 | Indonesia | 285,721,236 | 0.79% | 2,233,305 | 158 | 1,811,570 | −39,509 | 2.1 | 30.4 | 59.6% | 3.47% |
| 5 | Pakistan | 255,219,554 | 1.57% | 3,950,390 | 331 | 770,880 | −1,235,336 | 3.5 | 20.6 | 34.4% | 3.10% |
| 6 | Nigeria | 237,527,782 | 2.08% | 4,848,304 | 261 | 910,770 | −15,258 | 4.3 | 18.1 | 54.9% | 2.89% |
| 7 | Brazil | 212,812,405 | 0.38% | 813,832 | 25 | 8,358,140 | −217,283 | 1.6 | 34.8 | 91.4% | 2.59% |
| 8 | Bangladesh | 175,686,899 | 1.22% | 2,124,535 | 1,350 | 130,170 | −402,100 | 2.11 | 26 | 42.6% | 2.13% |
| 9 | Russia | 143,997,393 | −0.57% | −823,030 | 9 | 16,376,870 | −251,822 | 1.47 | 40.3 | 75% | 1.75% |
| 10 | Ethiopia | 135,472,051 | 2.58% | 3,412,284 | 135 | 1,000,000 | 24,054 | 3.81 | 19.1 | 22.5% | 1.65% |
| 11 | Mexico | 131,946,900 | 0.83% | 1,085,893 | 68 | 1,943,950 | −108,037 | 1.87 | 29.6 | 87.9% | 1.60% |
| 12 | Japan | 123,103,479 | −0.52% | −649,562 | 338 | 364,555 | 140,579 | 1.23 | 49.8 | 93.1% | 1.50% |
| 13 | Egypt | 118,365,995 | 1.57% | 1,827,737 | 119 | 995,450 | −57,305 | 2.71 | 24.5 | 40.9% | 1.44% |
| 14 | Philippines | 116,786,962 | 0.81% | 943,292 | 392 | 298,170 | −149,315 | 1.88 | 26.1 | 49.3% | 1.42% |
| 15 | DR Congo | 112,832,473 | 3.25% | 3,556,208 | 50 | 2,267,050 | −27,309 | 5.9 | 15.8 | 45% | 1.37% |
Source: Worldometers
| Country | Growth Rate (%) |
|---|---|
| Russia | -0.57 |
| Japan | -0.52 |
| China | -0.23 |
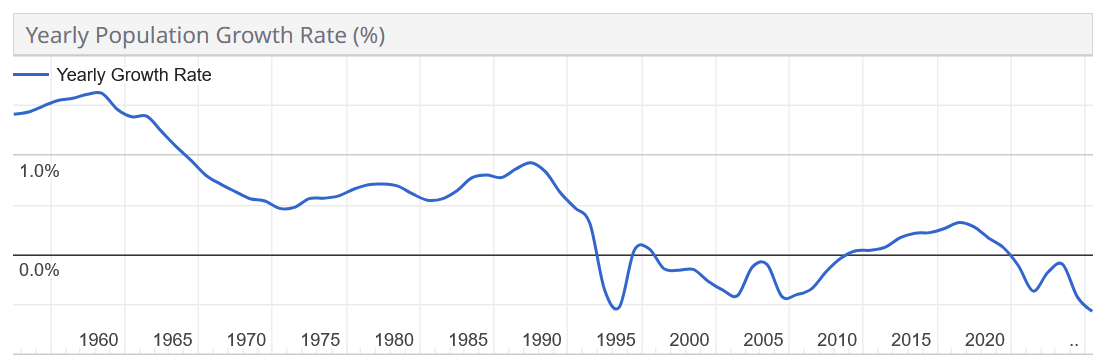
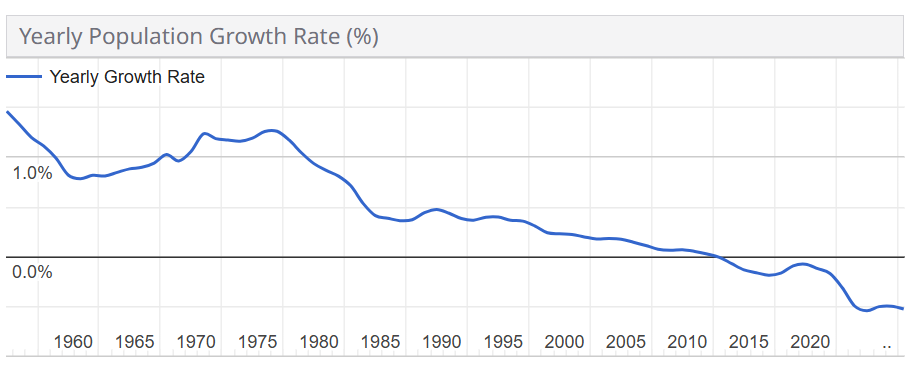
Russia, Japan, and China have negative growth rates, indicating a declining population. This can lead to challenges relating to an aging population, such as labor shortages and increased healthcare costs.
More specifically, Japan has increasingly higher costs of living and a low birth rate, leading to a shrinking workforce since people are increasingly less in a position where they can comfortably support a child. Russia faces similar issues, compounded by emigration (in part due to the impact of ongoing war) and health crises. China's declining population can be attributed to the years spent under the one-child policy.
| Country | Growth Rate (%) |
|---|---|
| DR Congo | 3.25 |
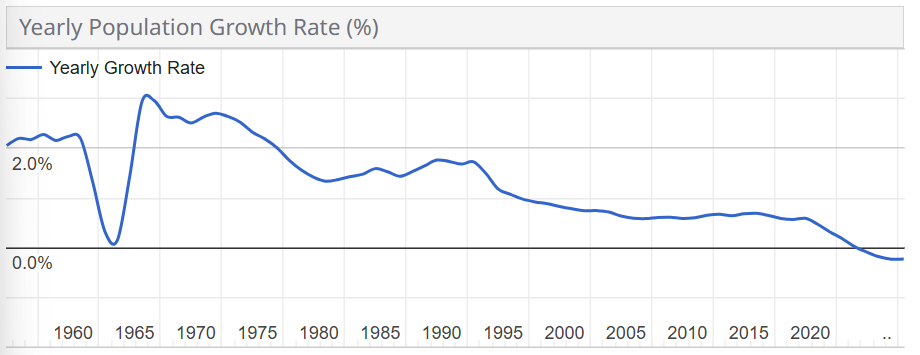
| Ethiopia | 2.58 |
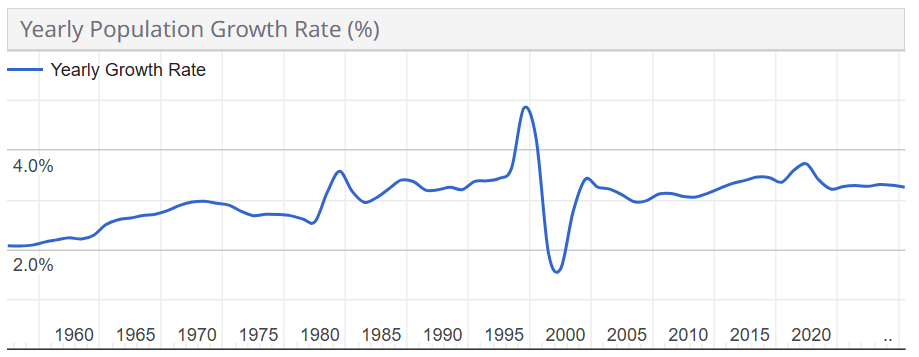
DR Congo and Ethiopia have the highest annual population growth rates among the top 15 countries. Rapid population growth can strain resources, though there are advantages to a higher working population.
This can be attributed to high fertility rates. For example, DR Congo has a fertility rate of 5.9, meaning that, on average, women in DR Congo have about 6 children. Ethiopia also has a high fertility rate of 3.81. Both countries also have relatively low median ages (15.8 for DR Congo and 19.1 for Ethiopia), indicating a young population with many individuals entering their childbearing years. It's also worth noting that, despite having the highest growth, they are not the highest population. This is usually because high fertility rates is often associated with high mortality rates as well.